Laser cladding is not as simple as “burning powder onto a part.” It is an energy–material–motion coupling that unfolds at millimeter and millisecond scales: the beam determines heat input, powder determines composition and mass, the melt pool determines the final structure, and the toolpath determines whether a local process can be repeated across an entire part.
Surface hardening Remanufacture and repair Directed energy deposition Digital process engineering
What happens during one cladding pass
Laser cladding uses a laser as the heat source to melt synchronously fed or pre-placed alloy material while only partially melting the substrate surface. The melt pool travels with the processing head and solidifies rapidly, forming a functional layer metallurgically bonded to the substrate. The method can add wear, corrosion, or high-temperature resistance to ordinary material, or restore the dimensions of shafts, dies, blades, and other high-value parts.
flowchart LR
    A[Clean and measure substrate] --> B[Prepare material and powder]
    B --> C[Calibrate laser and powder feed]
    C --> D[Form a stable melt pool]
    D --> E[Deposit a single bead]
    E --> F[Overlap tracks and stack layers]
    F --> G[Controlled cooling or heat treatment]
    G --> H[Inspect dimensions and defects]
    H --> I{Pass?}
    I -- Yes --> J[Finish and place in service]
    I -- No --> K[Trace parameters and path]
    K --> C
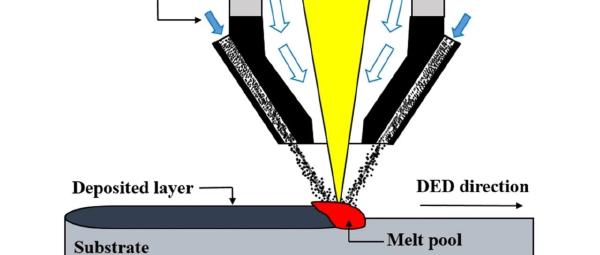
The three original process illustrations below can be swiped horizontally. The first emphasizes the spatial relationship between equipment, melt pool, and trajectory; the second focuses on powder-cone and melt-pool coupling; the third changes the viewing scale to the cross-section of the cladding layer.
These images explain process concepts. They are not equipment drawings or quantitative metallography. 1
Three scales, one melt pool
Energy input: do not be fooled by one “energy density”
Engineering teams often use a line-energy-like quantity for a quick comparison:
$$ E_l = \frac{P}{v} $$Here (P) is laser power and (v) is scan speed. It answers how much nominal energy is delivered per unit path length, but it cannot describe spot size, material absorptivity, powder shielding, defocus, or heat dissipation into the substrate. Two parameter combinations with the same (E_l) can still produce completely different melt-pool width-to-depth ratios.
A more reliable order of judgment: estimate input from power, speed, and spot size; validate it with melt-pool shape and bead cross-section; then close the loop with structure, hardness, and defect results.
Dilution: lower is not the only goal
In a cross-section, let (S_1) be the area of the cladding above the original substrate surface and (S_2) the area of substrate that was melted. A common definition is:
$$ D(\%) = \frac{S_2}{S_1+S_2}\times 100\% $$Excessive dilution can move the alloy composition away from its target. But very low dilution may also indicate insufficient fusion at the interface. Multi-track processing adds heat accumulation: the start temperature rises for later tracks, so penetration and dilution can drift. A 2023 multi-track study and simulation used the same area relationship to calculate dilution and showed how heat accumulation changes the temperature and dilution of later tracks. Read the original study
How parameters interact: a trend chart beats a list of “recommended values”
The radar chart below is a normalized trend illustration. It is not experimental data for a particular alloy; it helps show how several results may move together as energy input goes from insufficient, through a balanced window, to excessive.
| Variable | Most direct effect when increased | Observe at the same time |
|---|---|---|
| Laser power | The melt pool usually grows and penetration may increase | Dilution, heat-affected zone, spatter, distortion |
| Scan speed | Nominal heat per unit length usually falls | Lack of fusion, bead width, surface continuity |
| Powder feed | More mass enters the pool per unit time | Powder melting and capture efficiency |
| Spot diameter | Power density and interaction area change | Pool width-to-depth ratio and edge wetting |
| Overlap | Multi-track flatness and remelting ratio change | Heat accumulation, peaks and valleys, local dilution |
| Shielding / carrier gas | Powder-cone shape and atmosphere stability change | Oxidation, powder loss, pool disturbance |
Switch the strategy for the material system
Suitable for: cost-sensitive large-area wear resistance and dimensional restoration.
Main concerns: compatibility with steel substrates is often good, but high-carbon and high-alloy systems still need checks for hardened microstructures and cold-crack tendency. Start by checking the interface hardness gradient and heat-affected zone.
Suitable for: corrosion resistance, high temperature, and compositionally complex repair tasks.
Main concerns: segregation, brittle phases, and hot-crack sensitivity. For complex or highly constrained parts, preheat, interpass temperature, and heat treatment can matter as much as laser parameters.
Suitable for: high-temperature wear, erosion, and valve-seat surfaces.
Main concerns: material cost, performance after dilution, and microstructural differences caused by remelting across tracks. Surface hardness alone cannot judge the whole part.
Suitable for: introducing hard phases such as WC or TiC into a metal matrix to improve abrasive-wear resistance.
Main concerns: dissolution of hard phases, non-uniform distribution caused by density differences, interface embrittlement, and cracking. A more careful composition gradient and thermal strategy is usually needed.
A development rhythm from coupon to part
Define the service target
Stage 1
Start with why cladding is needed
Specify wear, corrosion, temperature, load, and dimensional-restoration requirements. Replace “higher hardness is always better” with testable performance indicators.Screen material compatibility
Stage 2
Substrate, powder, and transition layer
Check thermal-expansion mismatch, solidification range, possible brittle phases, and available post-processing. Design a transition layer or composition gradient when needed.Run a single-track window experiment
Stage 3
Build an explainable response surface
Vary power, speed, powder feed, and spot size while measuring height, width, depth, dilution, and powder utilization.Validate multiple tracks and layers
Stage 4
Include heat accumulation in the parameters
Set overlap, scan direction, dwell time, and interpass temperature. Check whether one parameter set stays stable at the first track, last track, and corners.Correlate process monitoring
Stage 5
Connect signals to physical events
Collect melt-pool images, thermal radiation, reflected light, acoustic signals, or machine state and register them against cross-sections and defect locations.Confirm at part scale
Stage 6
Verify geometry and service performance
Complete NDT, metallography, hardness or composition gradients, residual-stress checks, dimensional checks, and representative service tests before freezing the process card.
Common defects: what to ask after seeing the symptom
Click a heading below to expand a diagnostic path.
Porosity: powder, gas, or a melt-pool mode?
Cracks: solidification, liquation, or cold cracking?
Lack of fusion: too little energy, or powder missing the effective pool?
Geometry drift: why does the bead become wider and deeper?
Cracks and keyhole pores can both occur during directed energy deposition. One original study aligned acoustic signals with defect locations confirmed by microscopy and used a convolutional neural network for online recognition. “Listening to the melt pool” can therefore become part of multi-sensor monitoring, but the model still needs validation for the specific machine, material, and noise environment. Read the acoustic-monitoring study
Online monitoring: from seeing a bright spot to understanding energy coupling
Brightness in a coaxial camera is not absolute temperature. A single-band signal also cannot cleanly separate absorption, melt-pool geometry, and material emissivity. In powder-blown directed energy deposition, NIST researchers monitored relative temperature, material emission, and laser reflection in parallel. Their work shows why multi-band, multi-physics signals help explain laser–pool coupling and support more capable closed-loop control. Read the NIST study
flowchart TB
    S1[Coaxial visible / infrared] --> F[Feature fusion]
    S2[Reflected light and thermal radiation] --> F
    S3[Acoustic and powder-feed state] --> F
    S4[Robot pose and toolpath] --> F
    F --> M[Melt-pool state estimate]
    M --> C{Outside the window?}
    C -- No --> R[Hold parameters and record]
    C -- Yes --> A[Adjust power / speed / powder]
    A --> M
    R --> Q[Cross-section and NDT verification]
    Q --> D[Update process model]
    D --> F
A traceable minimum process record can start with a structure like this. The code block supports syntax highlighting, line numbers, and one-click copying.
| |
An executable checklist
- Powder batch, particle-size range, and drying state are recorded
- Spot, focal position, and beam–powder coaxiality are calibrated
- Substrate cleaning method and preheat temperature are recorded
- Single-track height, width, depth, and dilution are measured
- Multi-track overlap and heat accumulation are verified
- Defect locations can be aligned with process data in time or space
- Part-scale paths include starts, stops, corners, edges, and pose changes
- The final process card freezes parameters, material, gas, path, and acceptance rules together
Conclusion: upgrade the parameter table into a causal chain
The hard part of laser cladding is not that there are many parameters. It is that the same result can come from different mechanisms: a wider bead may come from higher power or heat accumulation; more pores may come from powder or from a change in melt-pool mode; lower hardness may come from dilution or from phase transformation and tempering.
A mature development logic follows this chain:
input parameters → beam–powder coupling → melt-pool state → thermal history → solidification structure → defects and performance → feedback correction.
Continue reading: dynamic article list
From 'It Runs' to 'It Can Be Maintained': Three Foundations of Reliable Systems
A practical path to stability through observability, fault isolation, and safer change.
Connect an AI Assistant to the Development Workflow: Optimize the Feedback Loop First
The key to AI coding efficiency is shortening the loop from an idea to reliable verification, not generating more code in one pass.
Technical Writing Is Not Filing Information; It Is Building Searchable Judgment
An archive method for technical writers: preserve context, decisions, evidence, and operating boundaries.
Further reading
- Zhu et al., Deep learning-driven precision control of dilution rate in multi-pass laser cladding: experiment and simulation, 2023. Springer
- Webster et al., In-situ, Parallel Monitoring of Relative Temperature, Material Emission, and Laser Reflection in Powder-blown Directed Energy Deposition, 2024. NIST publication
- Chen et al., In-situ crack and keyhole pore detection in laser directed energy deposition through acoustic signal and deep learning, 2023. arXiv
The three laser-cladding process illustrations were AI-generated to explain process structure. They are not equipment drawings, defect judgments, or quantitative metallography. ↩︎